A pivot table allows you to investigate data aggregated by one or more index columns. There are multiple options for creating a pivot table in pandas. We’ll explore two user-friendly functions: pd.pivot_table() and .groupby().
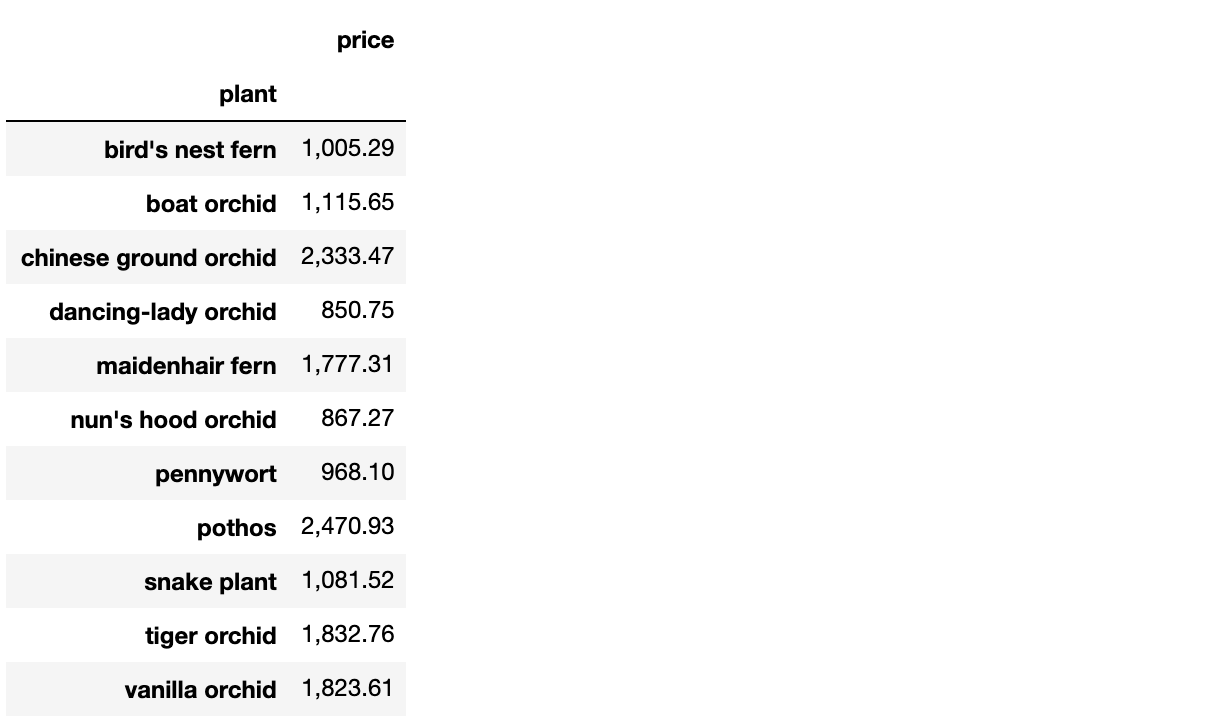
Let’s say we want to see the amount a greenhouse owner has spent per plant species. We can pivot with aggregation using either
pd.pivot_table(data, index=’plant’, values=’price’, aggfunc=np.sum)
or
data[[‘plant’,’price’]].groupby(by=’plant’).sum()
Either method will output the following:

We can also specify a multilevel pivot table using either method.
Checking piv.equals(piv0) yields True.
Here’s what the resulting DataFrame looks like:
