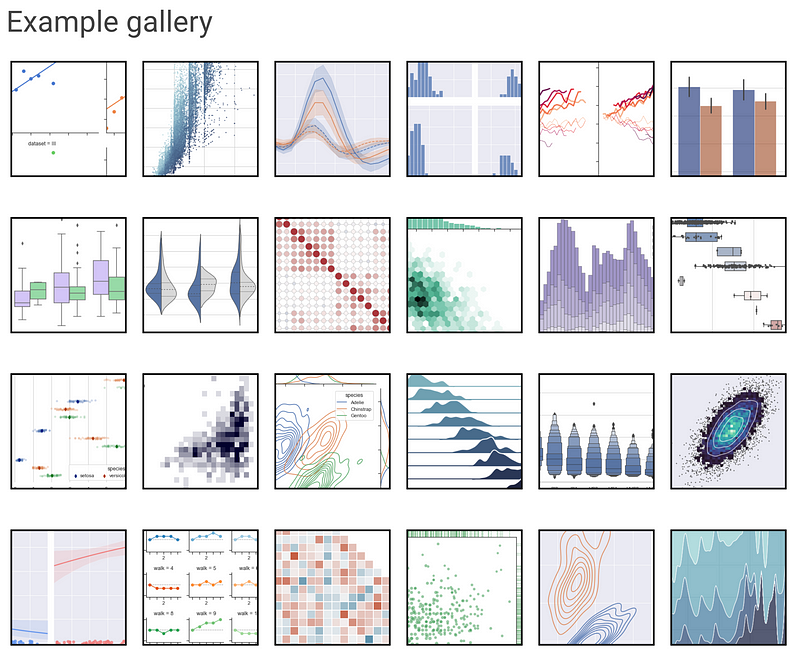
Visualizations aren’t just for business intelligence dashboards. Throwing in some helpful charts and graphs will reduce speed to insight as you investigate a new dataset.

There are many possible approaches to using data viz to advance your analytical capabilities. Some resources to explore: